Why Learning Our Price Action Trading Methodology Is Your Key To Trading Success
![]()
![]()
![]()
Every trader needs a Methodology to trade and this methodology must cover two basic functions. It must enable BUY and SELL signals based on buying and selling pressures and it must also enable you to know at what exact price your analysis/decision is WRONG!!
Without these TWO basic functions of a METHODOLOGY you have no chance of trading success as a Financial Trader.
We teach how to accurately read the Price Action of a Financial Trading Chart no matter the time frame and this subsequently enables you at all times to know the direction you should be trading and where a PROTECTIVE STOP should be exactly placed.
Having these two basic functions enables you to build a trading plan with risk controls and money management techniques, a must for long term trading success.
Trading price action from a technical analysis point of view is a professional way to trade any financial market. It is a leading indicator and not lagging unlike using traditional indicators such as moving averages etc. Indicators do have their uses but should not be used as the leading way from which to take trading signals. It is also worth noting that all indicators use price in their makeup so therefore being able to analyse price action correctly gives the foundation of a sound methodology and one that has stood the test of time. It is also worth remembering that price action exists in all financial instruments and in all time frames and will always continue to do so.
HOW DO YOU READ PRICE ACTION?
Part One of our Price Action Methodology begins with learning the basics and that begins by learning how to analyse a single vertical bar correctly. We particularly analyse OHLC vertical bars. (This stands for open, high, low, close vertical bars.) We like OHLC bars over Candlesticks because we are more interested in the closing price of the bar compared to the high and low of that bar. Candlestick chart bodies are dependent on where the closing price is compared to the opening price for their make-up. Bear in mind no matter the time frame of chart you are analysing the opening price is the OLDEST price and it only stands to reason the last traded price should be more important.
To reiterate the CLOSE is the most important thing to look at in any single vertical bar. Sometimes we read of people talking about the open being the most important. This is not correct because as has already being said it is the oldest piece of information relating to that bar. What qualifies a vertical bar as having more buying pressure or selling pressure is the relation of the close in comparison to the high or low of that bar. A close closer to the high is a sign the buyers are in control and a close closer to the low of the bar indicates that the sellers are in control.
After learning to analyse Single OHLC bars we the look at more of the basic price action set-ups such as the Dual vertical bars, Outside Vertical bars, Inside Vertical bars and low volatility bars.
Each one of the above helps to form the story that the chart is telling as regards to it’s next likely direction based on it’s current price action movements. To know this information and then being able to act accordingly is just so powerful.
Part Two of our PRICE ACTION METHODOLOGY then moves from the basics to the more advanced but yet very clear Vertical Bar Trading Pattern. Otherwise known as the VBTP.
This pattern occurs at the top and bottom of every traded Financial Market and in every time frame.
We have a very distinct set of rules that determines when a VBTP top or bottom is in place and then we go about trading this pattern based on it’s trend. Higher VBTP lows indicate LONG trades or a sign of strength. VBTP lower highs indicate SHORT trades or a sign of weakness.
When this information is used in conjunction with the overall price action of any instrument together with our unique trading tool it gives you a trading edge that is so very powerful and a massive help in your quest to be a successful Financial Trader.
Let’s Look at How to Analyse a Single Vertical Bar Correctly.
Learning how to analyse a single vertical bar properly really does improve your understanding of the price action of a chart and the next likely direction of that instrument. It indicates the probabilities of the high or low of the present bar being broken to the upside or downside next. Let us assume each vertical bar represents one day then a close of todays vertical bar being closer to the high (Bullish) indicates that tomorrow should see prices going higher than todays high (at least to begin with).
Understanding this is the beginning of understanding the very basics of price action. There is much more to price action trading than being able to analyse a single vertical bar (if only it was that simple) however we urge anyone trading to at the very least look at the price action of the Single Daily/Weekly bar make-up as it gives a clear and precise understanding of what the next general direction is anticipated to be. If a Daily time frame single OHLC bar was a BULLISH bar then the low of that bar is the support. A Bullish bar would indicate a break to the upside but on many occasions a market will not immediately go up. It might retrace into the previous days range. This can very often offer further buying opportunities as you have the information that the low of the previous days vertical bar is strong support. It is only when this low is broken without the previous days high being broken to the upside does this low no longer be support. Being able to know this single piece of information and then acting upon gives all traders a great platform from where to begin their trading journey. It is important no matter the time frame long trades should only be taken on bullish bar closes and vice versa for short trades. The reason for this is we always want to put the probabilities in our favour.
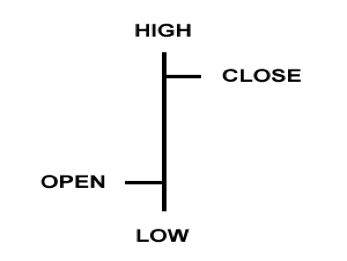
The Open Price begins a new trading period.
The High Price of the bar is formed when selling pressure overpowers the buying pressure.
The Low Price of the bar is formed when the buying pressure overpowers the selling pressure.
The Close is confirmation of price action and the sum total of all buying and selling pressure within that bar.The function of the close is to confirm price action.
Step 1 – Look where the close is in relation to the open.
Step 2 – The most important step is discovering if the close is closer to the High or Low of the bar.
This is done by finding the “Mean” or Mid point of the bar. Calculating the mean of the bar is done by adding together the High price and Low price and dividing by 2.
If the close of the bar is below the mean it is Bearish bar and above the mean is Bullish bar.
In the above example there is a high probability that the next trading period should break the high of the present trading period this bar relates to next. If this bar represented one day then the high of today should be broken to the upside first tomorrow. The low of this bullish example would be strong support until such times as the high is broken to the upside.
Think about this and you will see how this will immediately help in trading decisions.
REMEMBER THE ADVANTAGES OF TRADING USING PRICE ACTION ARE;
It is NOT LAGGING. No Cluttered charts.
It easily determines Buying and Selling pressures.
It indicates Clear and Precise Support and Resistance areas.
You know to the EXACT Point/Pip when a New Trend Begins & has Ended. (This enables you to know at all times where a PROTECTIVE STOP should be placed!!)